White Paper on Global Gas Trends (2020–2024). Natural Gas: What Has Happened in the Last 5 Years?
31 August 2025
1. Introduction
This paper is part of a series that analyses the results of the 2024 Energy Institute Database (formerly BP Statistics). Natural Gas: What Has Happened in the Last 5 Years? provides an overview of the global natural gas sector over the period 2020–2024. The dataset covers proven reserves, production, consumption, and prices, with disaggregation at both global and continental levels.
The past five years were marked by turbulence in the gas market, defined by three distinct phases:
- 2020: COVID-19 pandemic-induced economic slowdown and collapse in demand.
- 2021–2022: Rapid rebound in consumption, followed by unprecedented volatility due to Russia’s invasion of Ukraine and the consequent restructuring of global gas trade.
- 2023–2024: Stabilization of supply chains, strong growth in LNG trade and normalization of prices compared to the 2022 peak.
This review focuses on four key dimensions: reserves, production, consumption and prices.
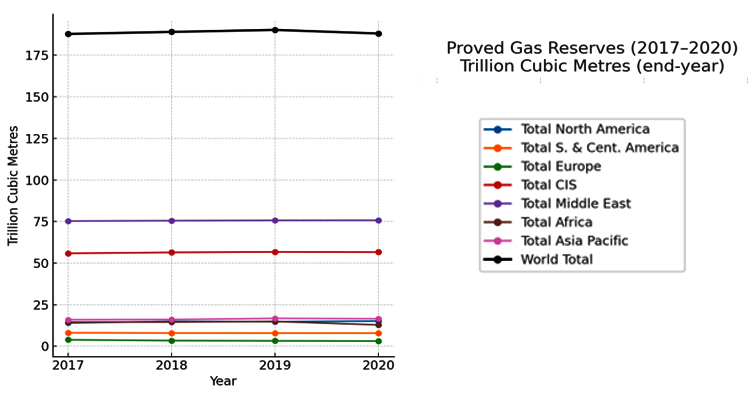
2. Evolution of Proven Gas Reserves
Proven natural gas reserves represent the recoverable volume under existing economic and technological conditions. Between 2017 and 2020 (last four years available), reserves remained relatively stable, reflecting both discoveries and consumption.
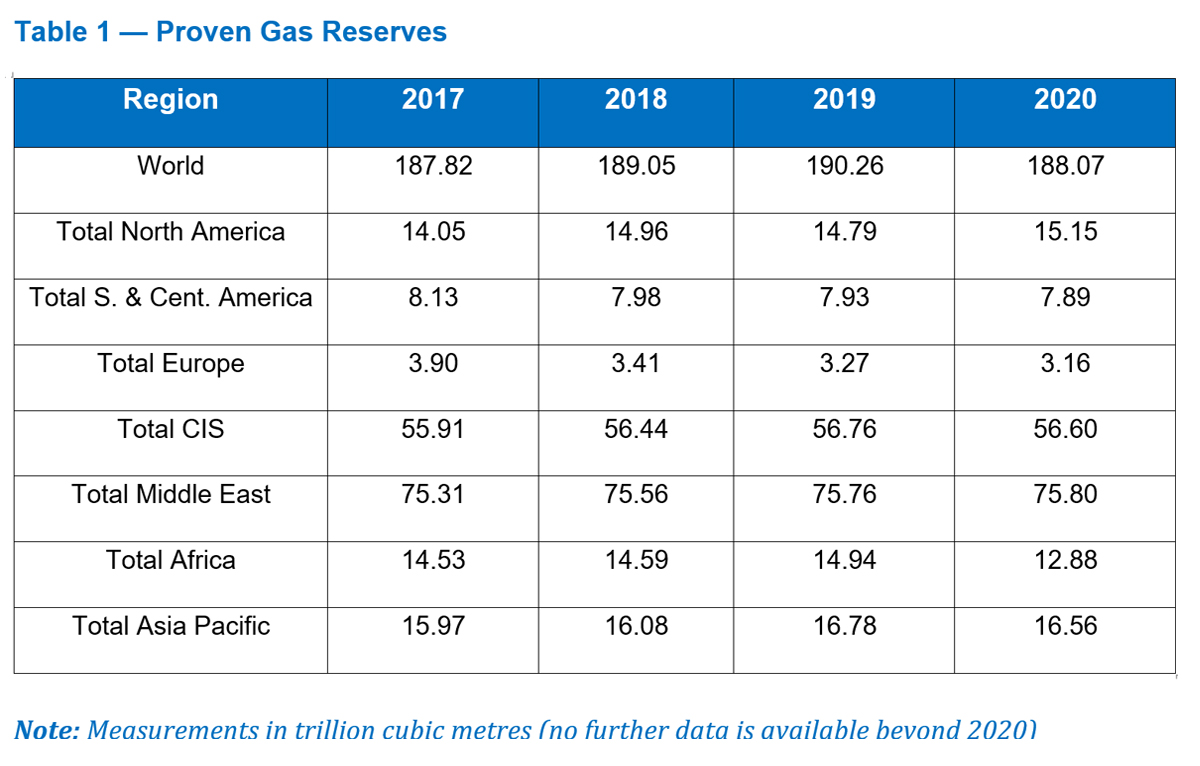
- The Middle East continues to hold the largest share of reserves, dominated by Iran and Qatar.
- Russia and Turkmenistan keep Eurasia as a significant reserve holder (second place).
- Africa’s reserves are concentrated in Nigeria and North African countries although other countries, such as Mozambique, look promising.
- North America shows modest reserve additions, with U.S. shale maintaining capacity.
While global totals remained stable, the Reserves-to-Production (R/P) ratio declined slightly, highlighting faster consumption growth relative to proven reserve additions.
3. Evolution of Gas Production (2020–2024)
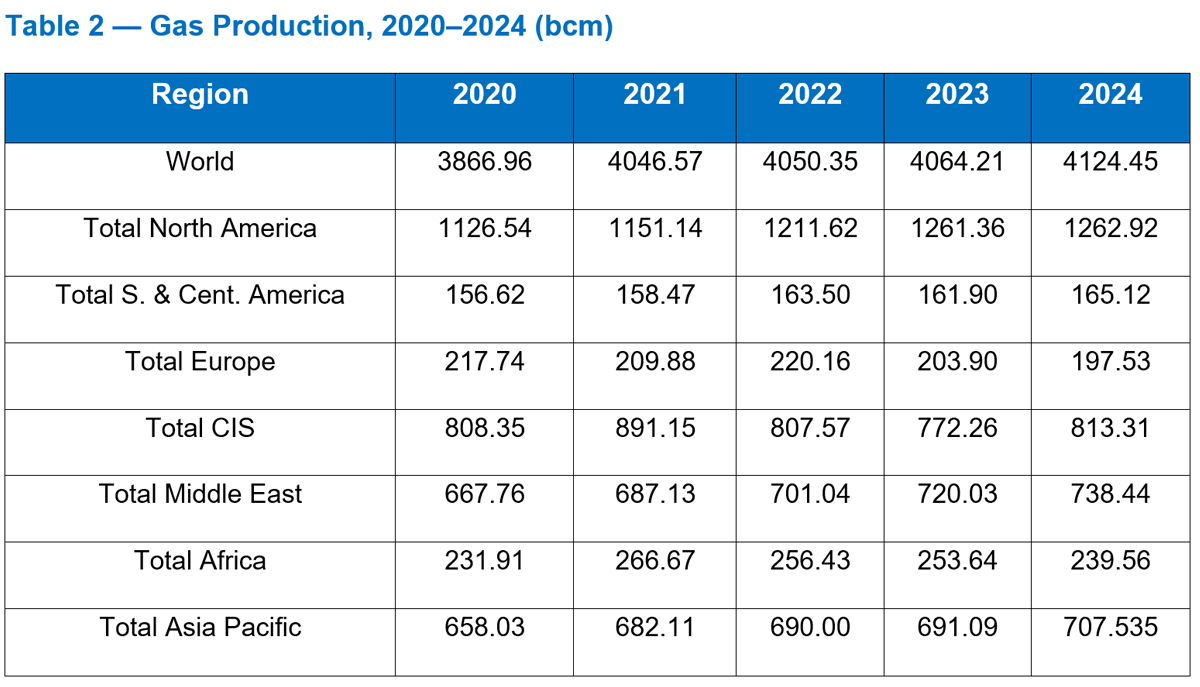
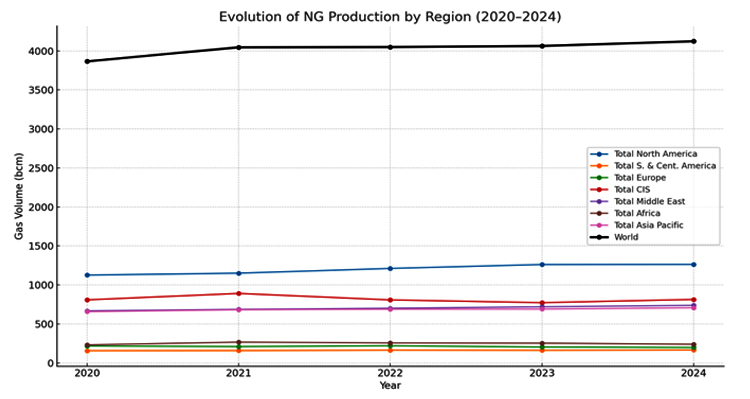
Key insights:
- North America (particularly the U.S. and Canada) increased shale gas output steadily.
- Russia saw significant declines from 2022 onwards due to sanctions and European demand redirection.
- Middle East and Asia-Pacific maintained robust growth, driven by LNG export capacity in Qatar and Australia respectively.
- Africa’s production was uneven, with new projects offsetting stagnation in mature fields. Overall, in 2024 continental production regressed to nearly pre-2021 level.
4. Evolution of Gas Consumption (2020–2024)
Consumption dynamics reveal the demand side pressures. Table 3 provides regional data (in bcm).
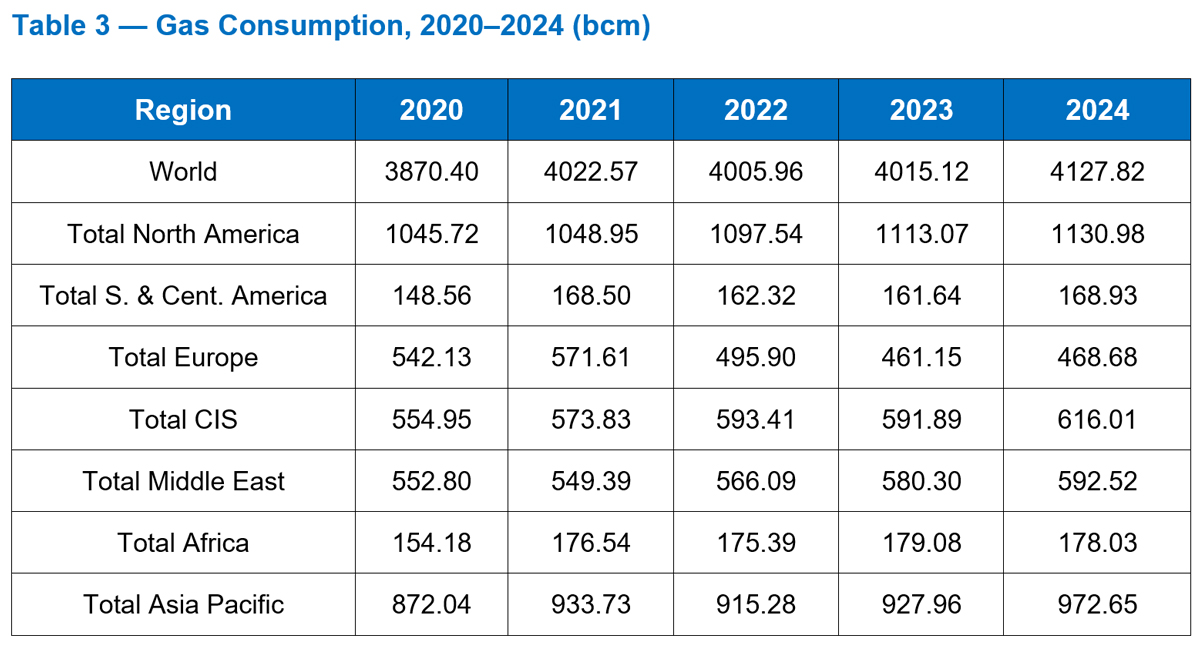
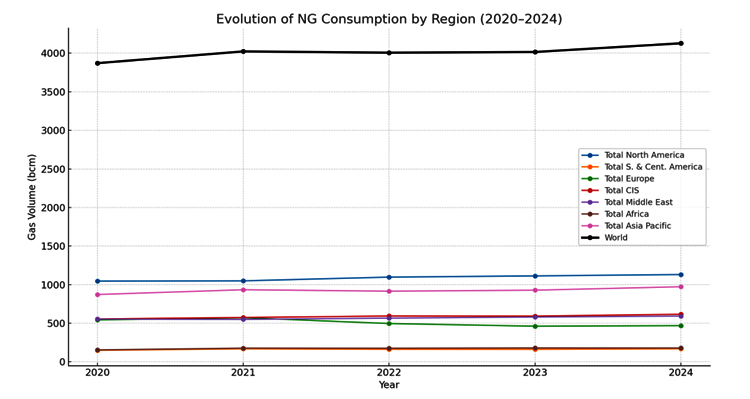
- Asia-Pacific and North America combined account for roughly half of global consumption.
- The three global largest consumers are U.S., Russia and China.
- Europe’s consumption fell sharply after 2022, reflecting both price effects and structural diversification away from Russian pipeline gas.
- For the same reasons out of the 30 listed European countries, only 12 registered a positive increase in the “growth rate per annum 2014-2024”.
- North America sustained high demand, with gas central to power generation.
- Middle East continued the increasing consumption trend.
- Africa continued the increasing consumption trend with sporadic low years (2024 and 2022).
5. Evolution of Gas Prices (2020–2024)
Gas prices saw extreme volatility. Table 4 presents LNG and pipeline hub prices in $/MMBtu.
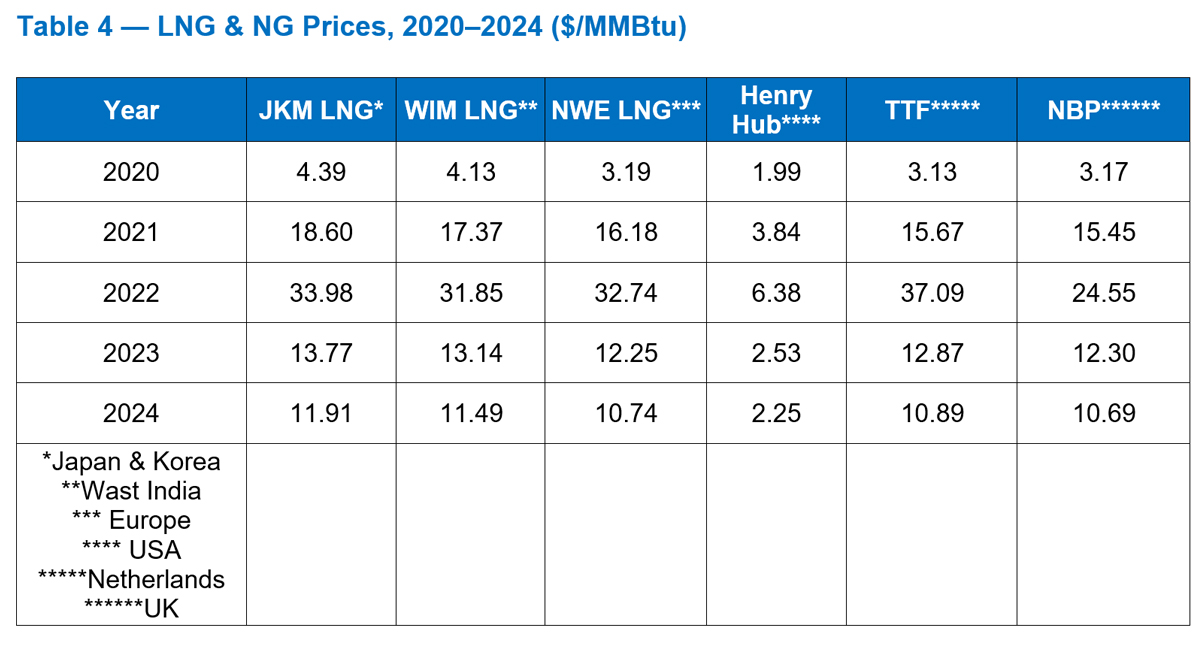
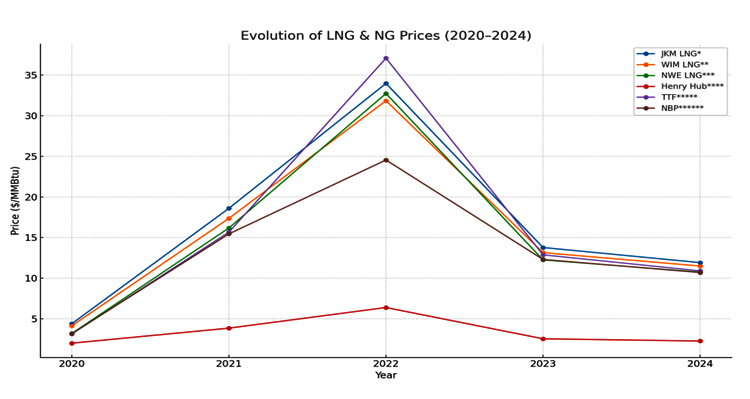
Key insights:
- 2020: Historical lows during the pandemic.
- 2021–2022: Explosive price surge, with LNG spot prices exceeding $30/MMBtu and TTF above $37/MMBtu.
- 2023–2024: Decline toward pre-crisis levels, but still higher than the 2010s average.
- LNG hubs (JKM, WIM, NWE) moved in parallel, underscoring global interconnectedness.
6. Conclusion
The global gas sector in 2020–2024 experienced three overlapping dynamics:
- Structural volatility: Prices moved from pandemic lows to historic highs and then partially normalized.
- Geopolitical realignment: Europe reduced dependence on Russian natural gas imported by pipe, triggering a boom in LNG trade flows.
- Asia-Pacific consolidated its role as the second main consumption hub, with India and China growth rate per annum in 2024 at 13% and 7% respectively.
- North America confirmed its leading role both in terms of production and consumption.
- Regional divergence persisted: Asia-Pacific ranked fourth in production but was the second-largest consumer
- Supply increasingly concentrated in the U.S., Qatar, and Australia.
Looking ahead, natural gas will remain central to global energy security, but its trajectory will be shaped by:
- The energy transition, as renewables and hydrogen expand.
- Geopolitical uncertainties, especially regarding Russia, Middle East stability, and potential trade bottlenecks (Suez, Malacca strait).
- Market integration, as LNG becomes the “swing supplier” balancing global demand in case of crisis (Wars, Pandemics), but also to rebalance the intermittence of renewable alternative sources of energy (Solar and Wind).